Model monitoring
This section shows the model monitoring capabilities of the Engine
- Using the GUI
- Using API access through SDK
Using the GUI
Once a deployed model has been used to predict on new data, the Engine starts generating various model health metrics. In the GUI, there are three sections where metrics are displayed:
- Covariance drift evolution
- Prediction data
- Traffic
Some model health metrics are computed dynamically in response to API calls, others are computed as scheduled batch analysis jobs and will update once daily. In addition, the information displayed under prediction data differs between classification and regression tasks.
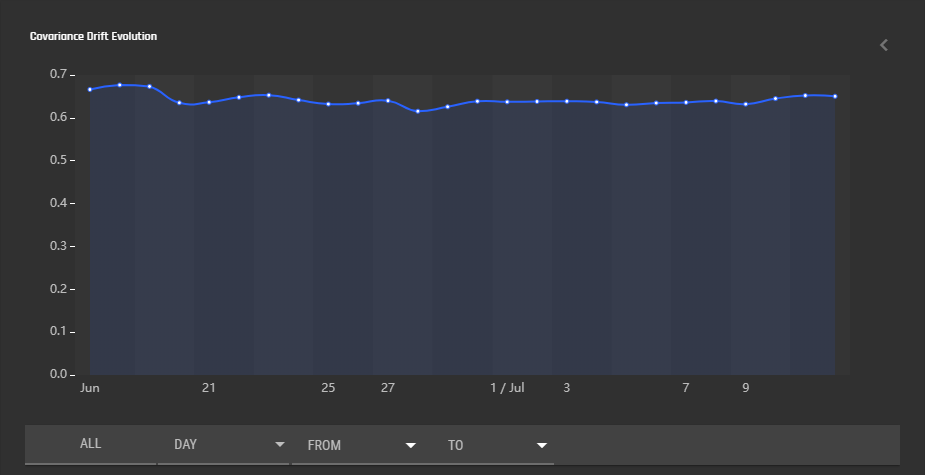
Covariance Drift Evolution
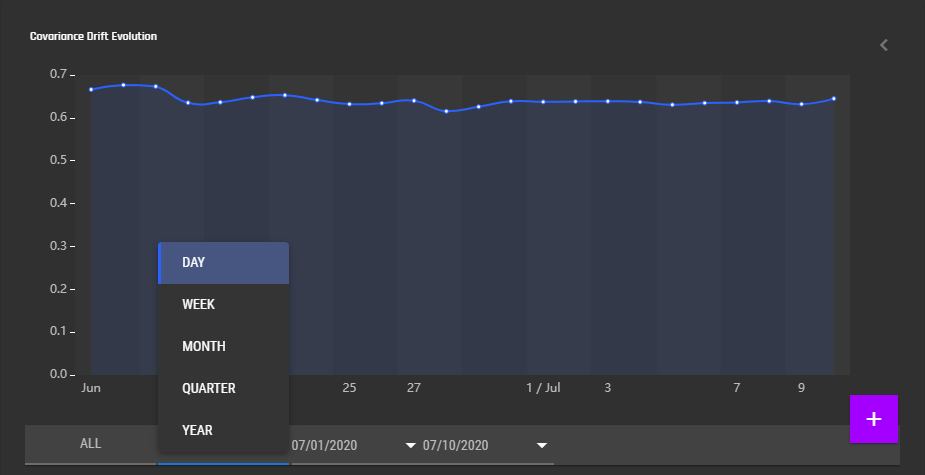
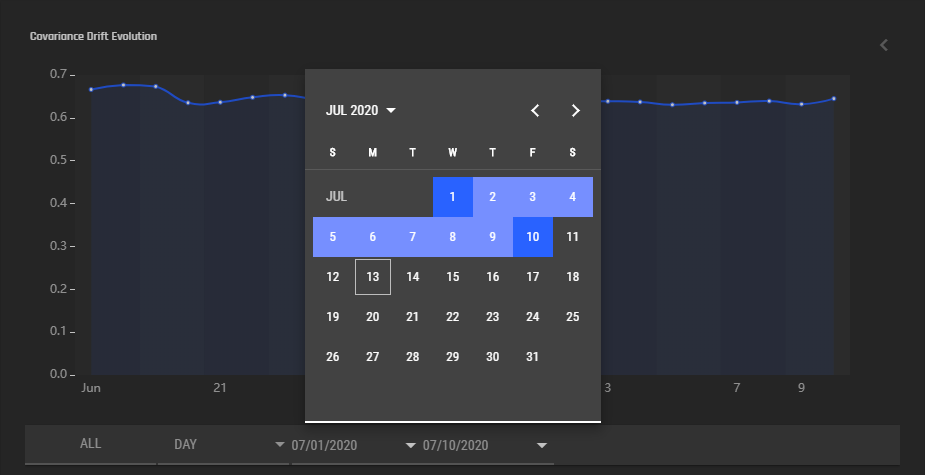
This section displays a graph that indicates how the characteristics of the input data evolve over time. The horizontal axis is time, which can be modified to display data during a given time window, and can be scaled to display data in daily, weekly, monthly, quarterly, and yearly intervals. The vertical axis gives the drift in input data characteristics — a value of 0.5 indicates no difference between training data and prediction data, >0.65 indicates significant drift. See Concepts/Model Monitoring for details on how this is calculated. Note that a covariate shift K-S test p-value (displayed in the sidebar to the right) significantly higher than 0.05 indicates that the covariate drift value may be unreliable. In this case, a drift value >0.65 may be a chance occurence rather than actual drift.
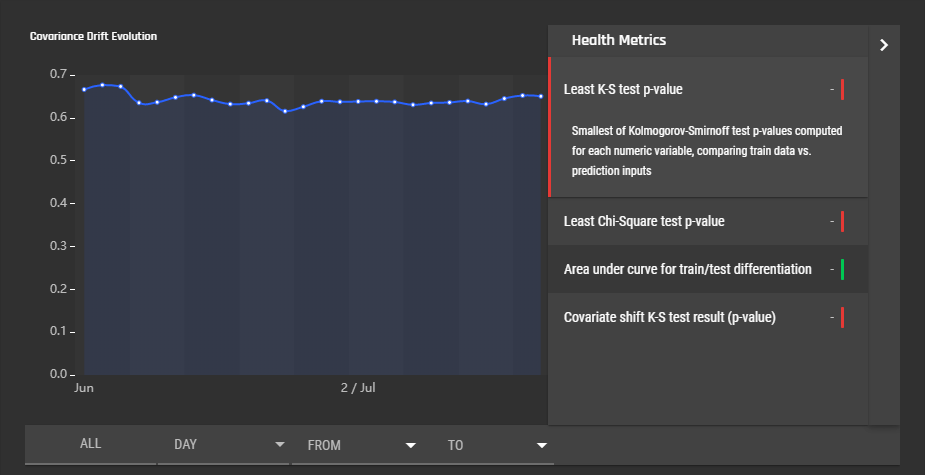
Upon clicking the side bar to the right of the graph, a bunch of model health metrics are displayed. Click the metric to display more information.
- Least K-S test p-value (over numerical features). Smallest of Kolmogorov-Smirnoff test p-values computed for each numeric variable, comparing train data vs. prediction inputs.
- Least Chi-Square test p-value (over categorical features). Smallest of Chi-square test p-values computed for each categorical variable, comparing train data vs. prediction inputs.
- Area under curve for train/test differentiation (expands to explain main graph)
- Covariate shift K-S test result (p-value). Lower values indicate a more reliable covariate drift graph. See Concepts/Model Monitoring for details.
Prediction Data
Classification Tasks
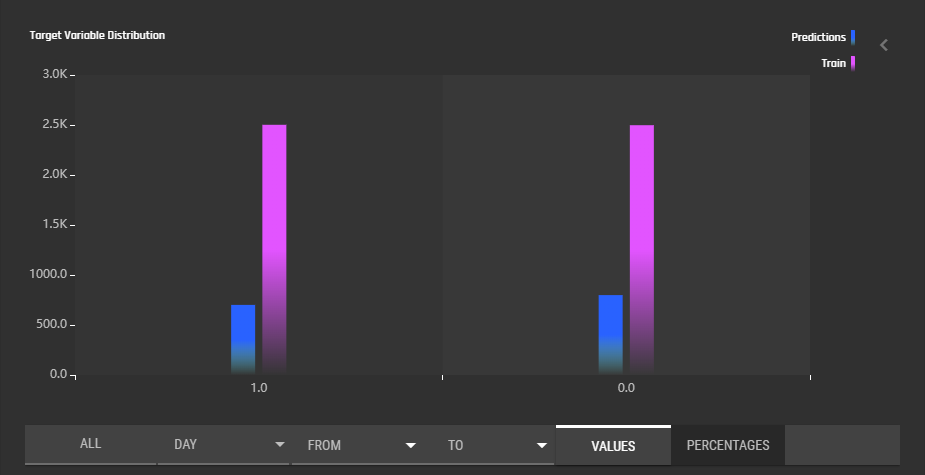
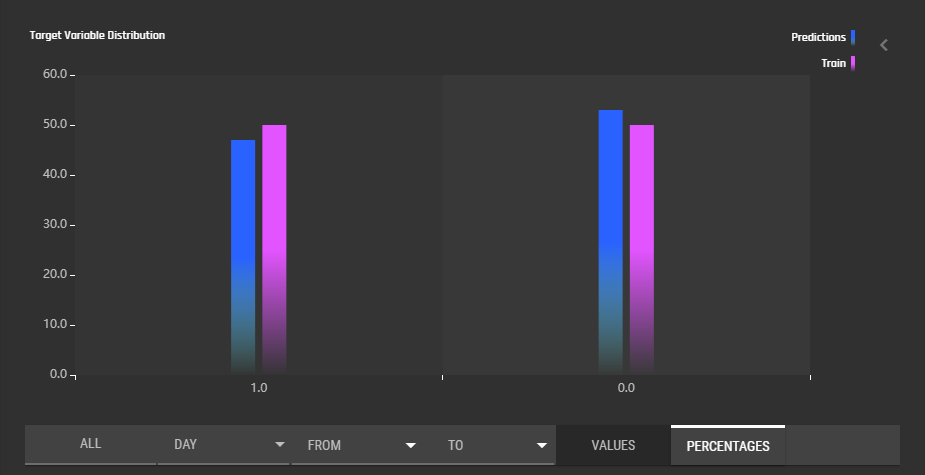
This section displays a histogram indicating the distribution of classes in the training set and in all the data that has so far been sent to the model for prediction. Raw values can be displayed in order to gauge the difference in the volume of prediction vs training data sent to the deployed model, and percentage values can be displayed to more clearly see the difference between the training and prediction distributions. As with covariate drift, you can select the calendar period over which to display the distribution of predicted classes.
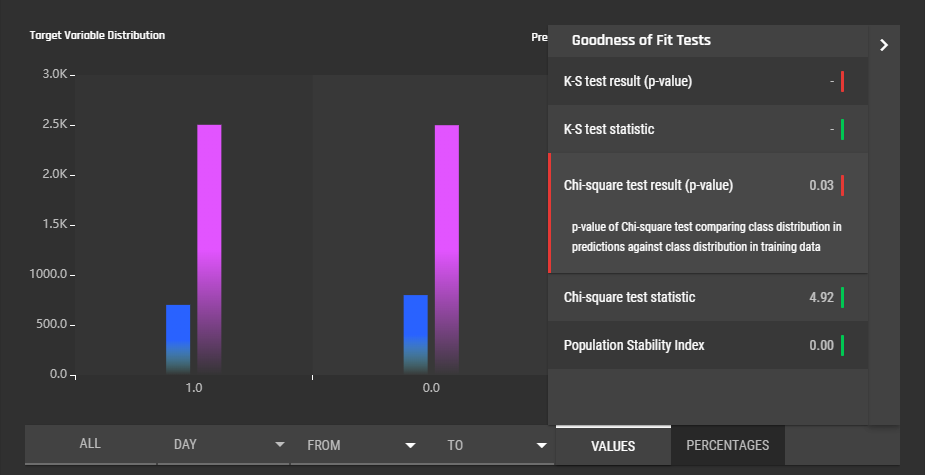
Clicking the side bar to the right will bring up a table with multiple goodness of fit metrics. See Concepts/Model Monitoring for more details.
- K-S test result (p-value)
- K-S test statistic (binary)
- Chi-square test result (p-value)
- Chi-square test statistic
- Population stability index
Regression Tasks
This section displays density plots of the target variable. Density plots of training data and prediction data are overlayed in contrasting colours for comparison.
picture missing
Clicking the sidebar to the right brings up a table of the following statistics:
- K-S test result (p-value)
- K-S test statistic
picture missing
Traffic
This section displays information regarding the model's use over time. The line graph can display the API calls, request sizes (in kB), error counts, and number of records over time, controlled using the buttons below the graph. Additionally, you can select the calendar period over which the information is displayed, as well as whether the time intervals between data points are daily, weekly, monthly, quarterly, or yearly.
picture missing
The sidebar to the right contains a summary of the total traffic over the model's lifetime:
- API call count
- Total size of requests (kB)
- Total number of errors
- Total number of records
picture missing
Using API access through SDK
tbd